Cross-Hole Verification of the Effect of Grouting for Ground Improvement

The Applied Geophysics Department at Orbis Terrarum has developed a technical article analyzing the results of a study using Cross-Hole tests as part of a stabilization project for a railway embankment where differential settlements were observed.
Cross-Hole for Slope Stabilization
The objective of the study was to investigate the embankment and its foundation from a dynamic behavior perspective, quantifying the improvement achieved by calculating dynamic moduli before and after grouting.
Two Cross-Hole seismic measurement campaigns were carried out: one prior to the injections and another after execution. Six (6) boreholes were drilled to evaluate the efficiency of the grouting treatment by comparing the dynamic moduli of the embankment.
STUDY OF THE GROUND IMPROVEMENT EFFECT OF SLEEVE-PIPE (TUBE À MANCHETTE) GROUTING IN A RAILWAY EMBANKMENT BASED ON DYNAMIC MODULES ANALYSIS USING THE CROSS-HOLE SEISMIC METHOD
Joaquin Dorronsoro1 & Christian Merino1
1. Orbis Terrarum Projects. Applied Geophysics Department.
Resume:
In this project, cross-hole seismic tests were conducted to investigate the effectiveness of a sleeve-pipe (tube à manchette) grouting treatment on an embankment experiencing settlement in northern Spain. Six boreholes were drilled, and the dynamic behavior was evaluated based on the estimation of dynamic moduli and Poisson's ratio before and after the execution of the grouting, which was implemented as a geotechnical solution to its pathology. It was determined that the method used was effective, and it was specified that the treatment proved more efficient at depth. Following the grouting, the embankment fill was characterized by a slight decrease in Poisson's ratio ν ...increased by 4.0%, and the dynamic moduli (G0, E0 y K0doubled, and the velocities (Vp and Vs)P y VS ...and seismic velocities ($V_p$ and $V_s$) increased by 53.0% and 90.0% respectively. For the colluvial Quaternary, a 2.0% decrease in Poisson's ratio was recorded, the dynamic moduli ($G$, $E$, and $K$) tripled in value, and the seismic velocities $V$P y VS improved by 69.0% and 75.0%.
I. INTRODUCTION
The Cross-Hole seismic method is based on generating a seismic signal within a borehole. P and S-waves are recorded using a triaxial geophone placed in an adjacent borehole. The source and the receiver must be positioned at the same depth. This process is repeated by lowering both the source and the geophone at small intervals along both boreholes, typically from the surface to the bottom.
The seismic signal generates both compressional and shear waves; the latter must be controlled by reversing their polarity to facilitate the identification of their first arrivals on the seismograms.
Analysis and processing are limited to determining the $V_p$ and $V_s$ seismic velocities of the ground at each testing depth. This is performed by calculating the ratio between the source-receiver distance and the travel time of the first arrivals of the wave trains. The primary challenge lies in the accurate identification of the first arrivals of the S-waves.
The signal processing assumes direct wave propagation, meaning that no refractions or reflections occur; therefore, the two boreholes must be located in close proximity to each other. The recommended maximum distance is approximately five (5) meters (Standard, 2004), in accordance with the ASTM D 4428/D 4428M standard.
Two Cross-Hole seismic measurement campaigns were conducted in this study: one prior to the injection works and another following their completion. Six (6) boreholes were drilled to evaluate the efficiency of the grouting treatment by comparing the dynamic moduli of an embankment that was experiencing settlements in Northern Spain.
II. METHODOLOGY
To ensure effective signal generation, transmission, and recording, high-quality drilling and grouting of the boreholes were required. Therefore, the general recommendations of the ASTM D 4428/D 4428M standard (Standard, 2004) were strictly followed:
• Following borehole drilling, high-pressure PVC casing (3” nominal diameter) was installed, with the annular space between the borehole and the casing filled with cement grout, and a bottom cap was fitted.
• A 24-channel PASI GEA24 seismograph was used for data acquisition during the seismic campaign.
Las componentes que se utilizaron para la ejecucio´n de las campan˜as se ex-presan a continuacio´n.
• 1 GFA-60 triaxial geophone placed inside the receiver borehole.
• 1 CHE-50 electromechanical seismic source installed in the source borehole.
• Measurements taken at 1-meter intervals with 4 orthogonal shots per depth.
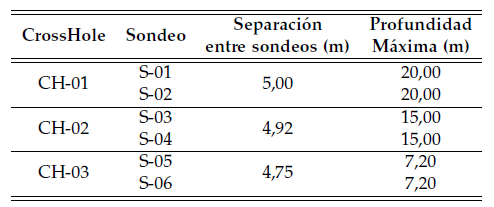
Table 1 provides a summary of the boreholes, their spacing, and the maximum depth of the tests performed.
Table 1: Summary of seismic tests performed.
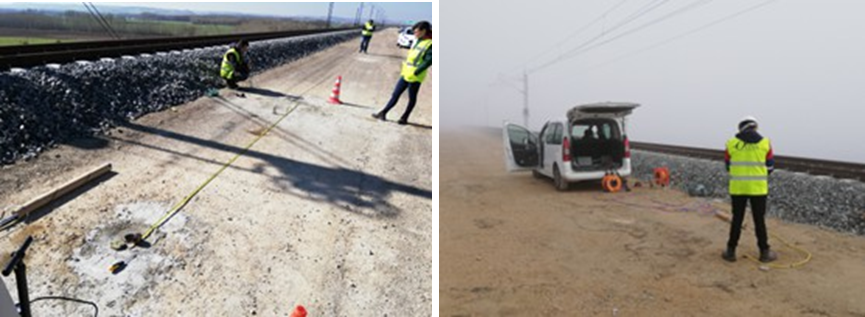
(a) April 2019 (b) December 2019
Figure 1: Execution of Cross-Hole CH-01 by Orbis Terrarum before and after the injection works.
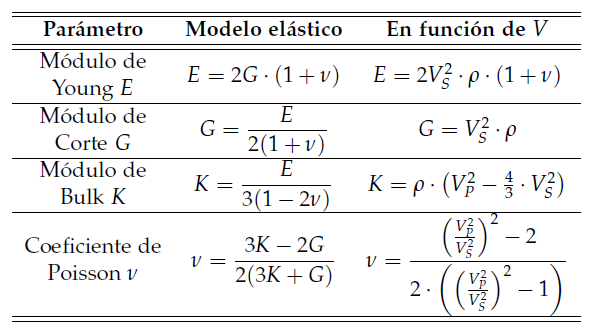
Data processing was performed using ReflexWin software to generate the seismograms, calculate the primary and secondary wave velocities, and determine the elastic parameters based on the expressions presented in Table 2.
Table 2 Expressions used for the calculation of dynamic moduli. Modified from Jia y Jia (2018)
Subsequently, the measured soil properties were mapped using Surfer software (version 14).
Used for the calculation of dynamic moduli, but not for the Poisson's ratio. νDensity data were specified for this analysis. Therefore, the values obtained from direct geotechnical testing were used as pre-injection values (April), whereas post-injection values (December) were estimated assuming a 10% increase in the original densities as a result of the cement grout injection. Accordingly, the following bulk density values were considered for the assumed geotechnical units:
CH-01:
Embankment filling
- ρapril = 2170 − 1980 kg/m3
- ρdecember = 2387 − 2178 kg/m3
Colluvial Quaternary deposits
- ρapril = 2070 − 2011 kg/m3
- ρdecember = 2277 − 2212 kg/m3
CH-02:
Embankment filling
- ρapril = 2070 − 2160 kg/m3
- ρdecember = 2277 − 2376 kg/m3
Colluvial Quaternary deposits
- ρapril = 2070 − 2011 kg/m3
- ρdecember = 2277 − 2212 kg/m3
CH-03:
Embankment filling
- ρapril = 2140 − 2170 kg/m3
- ρdecember = 2354 − 2387 kg/m3
Landfill waste o Landfill material
- ρapril= 2070 − 2110 kg/m3
- ρdecember= 2277− 2321 kg/m3
Colluvial Quaternary deposits
- ρapril= 2110 kg/m3
- ρdecember= 2321kg/m3
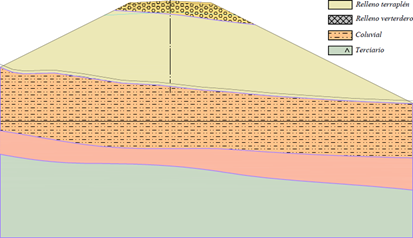
Figure 2: Longitudinal profile of the embankment where CH-01 was located.
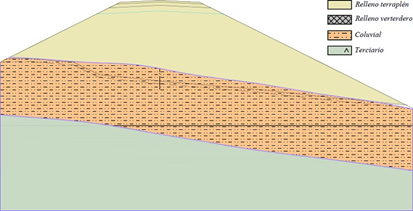
Figure 3: Longitudinal profile of the embankment where CH-02 was located.
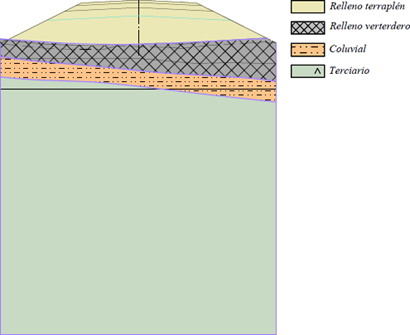
Figure 4: Longitudinal profile of the embankment where CH-03 was located.
III. RESULTS
Seismic Velocities
The following is presented in the figure below: 5 four profiles representing the different measured velocities, both pre-injection (VP and VS April) and post-injection (VP and VS Diciembre).
The raw data obtained from the CH-01 borehole were clear; however, in December, difficulties were encountered in identifying the first arrivals of the waves in boreholes CH-02 and CH-03. SThis is typically due to the displacement of the casing caused by the injections performed, which obstructed boreholes CH-02 (at a depth of 15 m) and CH-03 (at a depth of 7.20 m).
Al comparar los resultados obtenidos de los registros de velocidades de ambas campan˜as se evidencio´ un aumento sig-
Abril) como despue´s de ellas (VP and VS Di-
ciembre).
The raw data obtained from the CH-01 borehole were clear; however, in December, difficulties were encountered in identifying the first arrivals of the waves in boreholes CH-02 and CH-03. SThis is typically due to the displacement of the casing caused by the injections performed, which obstructed boreholes CH-02 (at a depth of 15 m) and CH-03 (at a depth of 7.20 m).
Comparing the results obtained from the velocity records of both campaigns, a significant increase was observed in all three tests conducted. This improvement is attributed to the effect of the grout injection. Consequently, the embankment increased its compactness and stiffness, thereby reducing the travel time of the disturbances as they passed through the material.
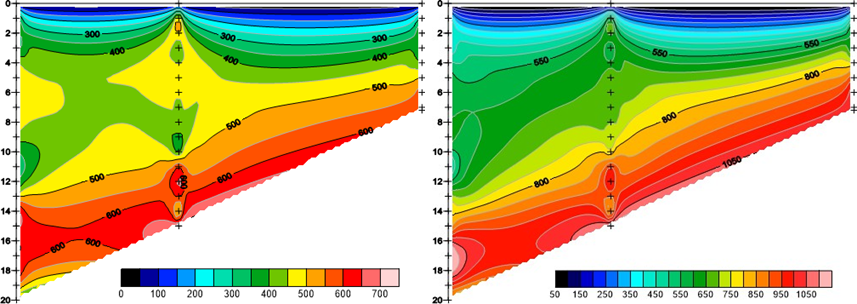
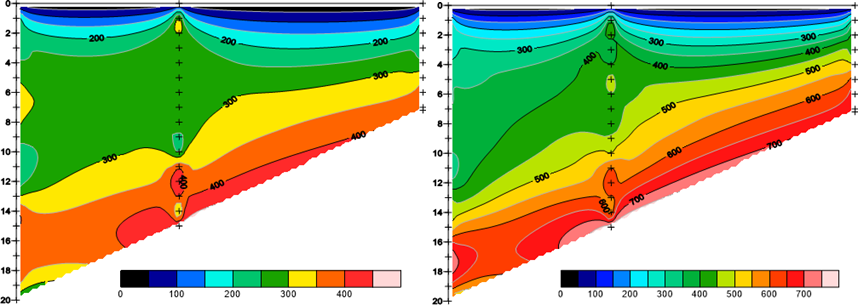
Figura 5: Comparación de las velocidades VP y VS de los pozos de abril a diciembre.
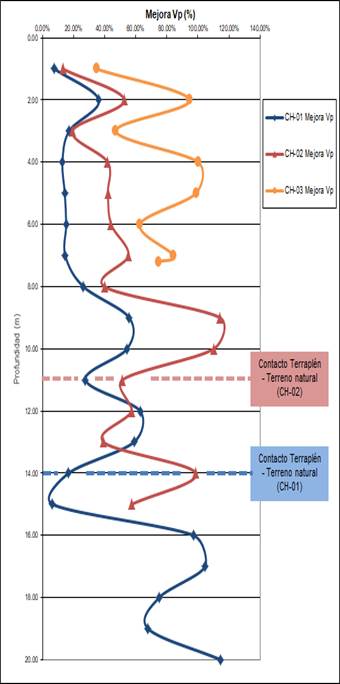
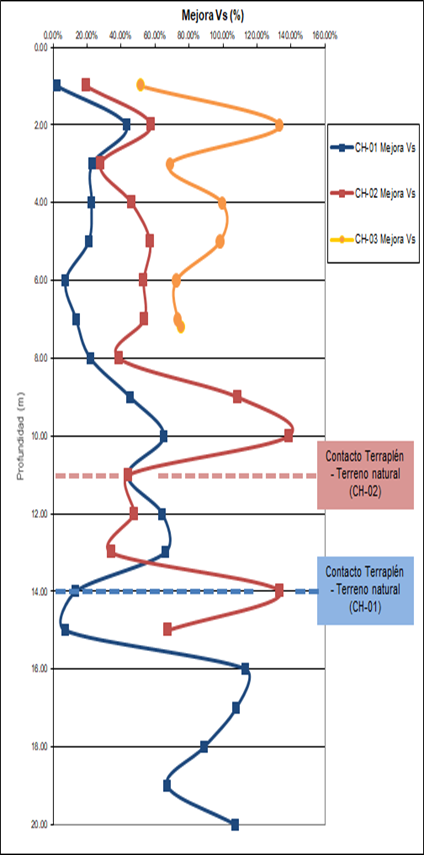
A continuación, se presentan los valores porcentuales correspondientes a la mejora de las velocidades entre ambas campañas (abril-diciembre) en función de las profundidades registradas (ver fi-gura 6). En términos generales, el CH-01 obtuvo una mejora aproximada del 50 %, mientras que el CH-02 del 60 % y, final-mente, el CH-03 fue el ensayo en el que se registraron mayores mejoras porcentuales (media 70 %). Cabe destacar que este último representó un mayor aumento debido que los datos de esta investigación abarcaron únicamente 7,20 metros por una obturación del sondeo.
(a) VP
(b) Vs
Figura 6: Valores porcentuales correspondientes a la mejora de las velocidades VP y VS.
Se observa que entre uno y tres metros se distingue un aumento significativo y, posteriormente, un descenso en la mejora de las velocidades sísmicas VP y VS. Esto se atribuye a que en las zonas de tratamientos más cercanas a la superficie del terraplén la inyección de la lechada no resulto´ tan efectiva como se observa en profundidad, pues se limitan más las presiones del tratamiento para no romper el terreno y, evitar posibles fugas de la mezcla. Por otra parte, se denota el contacto terraplén terreno natural a los 11 metros como consecuencia de la disminución paulatina de la densidad para el CH-02 y, por el mismo motivo para el primer ensayo a los 14 metros.
Tal y como se muestra en los perfiles de velocidad y en las gráficas de mejora (figuras 5 y 6), se logra apreciar durante los primeros tres metros aumentos del 20 % y 30 % para los ensayos CH-01/CH-02 y 90 % para el CH-03 de la VS. As´ı, posteriormente a la inyección de la lechada la velocidad de la onda de cizalla VS alcanzo´ los 300 m/s que según Kul-hawy y Mayne (1990) puede atribuirse a un perfil de suelo duro o denso (medianamente rígido).
Entre los tres y los ocho metros se es-timaron aumentos del 20 %, 40 % y 70 % de la VS en los ensayos ejecutados. La velocidad de la onda de cizalla alcanzo´ los 500 m/s lo cual se correlaciona con un perfil de suelo muy duro o muy den-so/roca blanda.
Finalmente, a partir de los 11 metros para el CH-02 y 14 metros para el CH-01, donde se localiza el contacto terraplén con el terreno natural, se determinaron aumentos del 60 % y 80 % de la velocidad VS para ambos ensayos. Se alcanzan valores iniciales de 500 m/s y llegan hasta 700 m/s lo cual puede asociarse a un perfil de roca blanda.
Modulos dinámicos
A partir de los datos obtenidos, se calcularon los módulos de deformación dinámica (G0, E0, K0 y el coeficiente ν) con el fin de caracterizar el comporta-miento elástico del terraplén para un rango de muy baja deformabilidad (< 10−4 %).
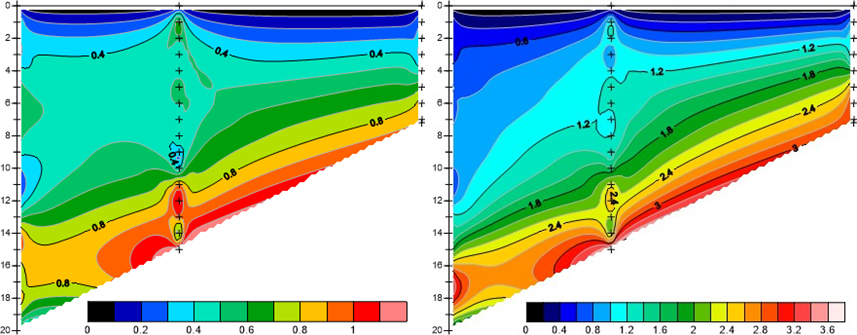
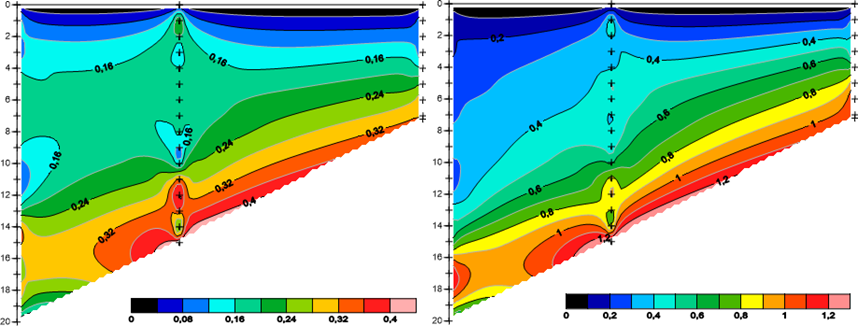
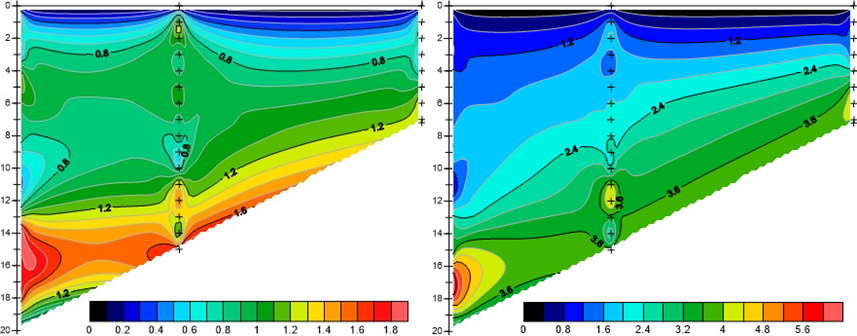
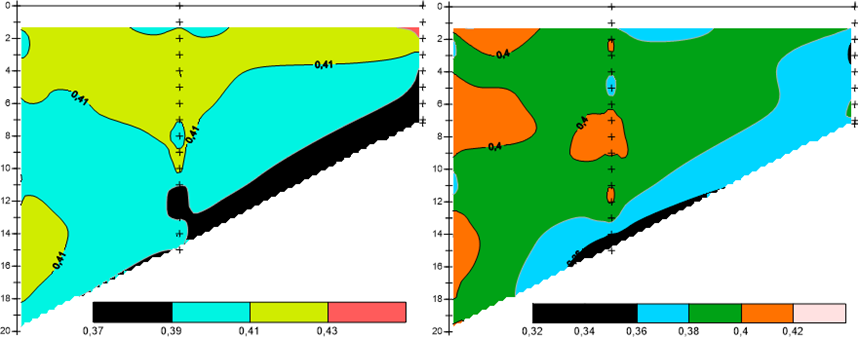
Se presentan a continuación las variaciones de los módulos elásticos obtenidos en función de la profundidad de cada sondeo (ver figuras 7 and 8).
(a) E Abril (GPa) (b) E Diciembre (GPa)
(c) G Abril (GPa) (b) G Diciembre (GPa)
Figura 7: Variación del módulo de Young (E) y de rigidez (G) antes y después de las inyecciones.
(a) K Abril (GPa) (b) K Diciembre (GPa)
(c) v Abril (d)v K Diciembre
Figura 8: Variación del módulo de Bulk (K) y del coeficiente de Poisson (ν) tanto antes como después de las inyecciones.
Al igual que en la sección anterior, se evidencia un incremento general de los módulos dinámicos calculados. Se observa que en los ensayos de la primera campaña no se caracteriza una tendencia clara respecto a los valores obtenidos, debido a la naturaleza anisotrópica y a la heterogeneidad de la composición del material del terraplén. Consecuentemente posterior a la inyección de la lechada se observa una distribución uniforme y un aumento gradual de la rigidez y compacidad de las unidades tratadas. Gracias a esto, se comprueba que el tratamiento por inyecciones de tubo manguito resulto ser, en términos generales, eficiente como solución geotécnica sin que en este documento se valore si es suficiente para el fin buscado.
Al evaluar los valores de los módulos dinámicos posterior al tratamiento, se evidencia la mayor efectividad de la campaña entre los 3 y 14 metros para el en-sayo CH-01 y para los 11 metros en el CH-02; esto en comparación a los primeros metros para el relleno de terraplén en el que se destaca la poca variabilidad de las propiedades elásticas del material que compone el terreno.
No se observan variaciones significativas del coeficiente de Poisson (ν). Los valores de este parámetro varían entre 0,32 y 0,44 sin una tendencia clara y, al considerar los valores obtenidos y los propuestos por Boiero y Rosales (2016), el material presente se relaciona con un sustrato denso tanto antes como después de la inyección lechada.
IV. CONCLUSIONES
El método sísmico cross-hole resultó ser una tecnica eficiente para caracterizar el efecto de las inyecciones por tubo manguito de un terraplén ferroviario que presentaba asientos. Además, se manifestó como un método efectivo que ofrece información fiable sobre las velocidades de las ondas primarias y secundarias.
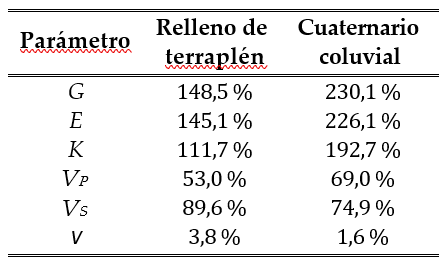
El relleno de terraplén se caracterizó tras las inyecciones con una ligera disminución del coeficiente de Poissón ν del 4,0 %, los módulos dinámicos (G, E y K) se duplicaron y, las velocidades VP y VS se incrementaron en un 53,0 % y 90,0 %.
Para el Cuaternario coluvial se registraron descensos del coeficiente de Poissón ν del 2,0 %, los módulos dinámicos (G, E y K) triplicaron sus valores y las velocidades sísmicas VP y VS mejoraron en un 69,0 % y 75,0 %. Estos resultados se resumen en la tabla que se expresa a continuación (ver tabla 3).
Tabla 3: Porcentaje de mejora de las propiedades elásticas de cada unidad geotécnica
Se recomienda para futuros estudios con relación al tratamiento por inyecciones, la ejecución de ensayos de densidad tanto antes como después del tratamiento, para así reducir la incertidumbre con respecto al cálculo de los módulos dinámicos. Además, resulta importante reflejar la importancia de un correcto cementado del anillo anular de los sondeos.
Por otra parte, cabe resaltar la importancia de la utilización del método ejecutado para la estimación de las velocidades primarias y secundarias. A partir de la aplicación de ensayos cross-hole se consigue una muy buena resolución por intervalo medido y se garantiza en contraste a la sísmica de refracción convencional que, la onda directa se perciba por el geófono antes que la onda refractada. Por otra parte, en comparación a métodos como el ReMi, permite obtener registros sin depender de la presencia de ruido ambiental, pues la implementación de una fuente artificial para el análisis espectral de la técnica de microtremores limita la banda de frecuencias y por tanto dificulta su procesamiento e interpretación. No obstante, la técnica combinada de ReMi más sísmica de refracción es también muy útil cuando la rigidez aumenta en profundidad y no hay un estrato duro en superficie; además, este método combinado permitiría ahorrar costes por no necesitar de sondeos.
REFERENCIAS
Boiero, A. y Rosales, C. (2016). Estimación de parámetros elásticos para el cálculo de asentamientos inmediatos en suelos friccionantes y cohesivos. Boletín Técnico Sociedad Venezolana de Geo-tecnia (SVDG), pp. 1–7.
Jia, J. y Jia (2018). Soil dynamics and foun-dation modeling. Springer.
Konkov, A., Oshkin, A., Ragozin, N., Ig-natev, V., y Ermakov, R. (2017). Cross-hole seismic testing on pressure and shear waves-an example of effective usage of the method. En 23rd European Meeting of Environmental and Enginee-ring Geophysics, volumen 2017, pp. 1–5. European Association of Geoscientists & Engineers.
Kulhawy, F. H. y Mayne, P. W. (1990). Manual on estimating soil properties for foundation design. Technical report, Electric Power Research Inst., Pa-lo Alto, CA (USA); Cornell University, Ithaca.
Sirles, P. C. y Viksne, A. (1990). Site-specific shear wave velocity determina-tions for geotechnical engineering applications. Geotechnical and enviromen-tal geophysics, 3:121–131.
Standard, A. (2004). D4428/d4428m-07,
2007, standard test methods for cross-hole seismic testing. astm international, west conshohocken, pa, 2007, doi: 10.1520/d4428 d4428m-07.
Troncoso, J. (1979). Cross-hole and down-hole vs by mechanical impulse. Journal of the geotechnical engineering division-asce, 105(1):118–118.

