Application of the electrical tomography technique in the design of a soil-nailing reinforcement for a slope in karstic limestone and sandy colluvial
This case studies the implementation of a large slope in the newly built A8 motorway, located close to Buelna (Asturias), where a mesh of electrical tomography profiles has been used to detect the presence of karstified limestone ridges under sandy colluvium. The results collected were used to design a steeper slope and to undertake the necessary improvements of the colluvial area by using soil-nailing techniquessoil-nailing. This reinforcement proves to be a more suitable solution, when necessary, than other more expensive options.
I. Pérez-Santisteban & J. Dorronsoro Pérez
Dept. of Geophysics, Orbis Terrarum, Madrid, Spain
F. Puell Marín
Technical Department, Orbis Terrarum, Madrid, Spain
1. INTRODUCTION
Excavations for the new A-8 road lying on colluvial deposits involve the creation of slopes with potential instability problems. The particular case of the slope studied in this article is located near Buelna in Astu- rias, so instability problems are compounded by fre- quent rainfall typical of the region.
The first excavations already showed that the sloping designed 3H:2V and 20 m high with no additional support were unstable. The option to lower them to 2H:1V would have involved the occupation of a large number of properties, as well as increasing both constructing difficulties and costs. Therefore, it was necessary to reinforce the slope with a technique that exploited the possibility to know the position of bedrock.
Through a number of boreholes and some nearby outcrops, it was known that beneath the colluvium there was limestone bedrock. However, the topography of that bedrock was unknown. The limestones in this area are well karstified, and have an irregular and discontinuous distribution that is filled by colluvial material. Yet, due to the high gradient of the slope that would have required the creation of complicated road access, it was difficult to investigate the position of bedrock from boreholes (Fig. 1).
To avoid this problem, and in order to know the distribution of the limestone bedrock, a geophysical campaign using electrical tomography technique was arranged. With the results, the slope reinforcement design would be as efficient as possible.
Electrical tomography is a noninvasive survey that discloses the electrical resistivity of the subsurface materials providing an image depth of layers having different electrical behavior.
In this study, the objective of the Electrical Tomography Campaign was to obtain the resistivity values of the materials in depth in order to determine the contact of Quaternary colluvial materials with underlying limestone formation. To do this a mesh of 10 electrical tomography profiles was designed: 9 cross section profiles and 1 longitudinal that corre- lates the others.
The results of the geophysical campaign did locate the contact between the limestone and colluvial deposits, which enabled a new study of the stability of that section with the new features defined.
The geophysical campaign interpretation showed more accurately the distribution of limestone bedrock along the slope. It made a solution available in which the slope is more vertical, stabilizing the upper part by soil-nailing.
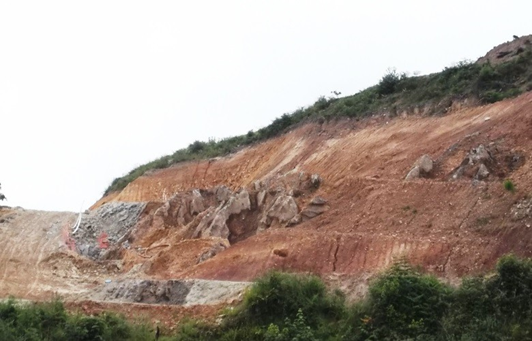
Figure 1. Slope before reinforcement action. Some limestone ridges are visible outcropping at the bottom of the slope.
2. PROJECT DESCRIPTION
New A-8 road is located in the Cantabrian area of the Iberian Massif. Specifically, the slope investigated is situated in the municipality of El Peral (Asturias) and is mainly formed by colluvial deposits under which the Calizas de Montaña Formation appears.
Quaternary colluvial deposits are sometimes very thick, overlying Paleozoic materials (quartzite) in the higher areas and limestone in the lower areas. Colluvium deposits are caused by debris on the slopes so that they are composed of cobbles and blocks of the constituent materials of the slope (quartzites, sandstones, limestones) with a variable content of sandy clay matrix.
Underlying the Calizas de Montaña formation is located. These limestones have been observed in nearby outcrops and are characterized by a high degree of karstification generally regarded as discontinuous outcrops and ridges morphology. Thus, the slope is formed by thick colluviums overlying the limestone karst.
The excavation for the A-8 road on these colluvial deposits involves slopes of great instability for their lithological nature; also instability is worsened by frequent rainfall occurring in the area.
Containment measures originally designed consisted of 37° slope. This design involved the occupation of a large number of properties in addition to being difficult to build and very expensive.
Therefore, knowing the distribution of the limestone bedrock allow a more efficient slope reinforcement design, that takes advantage of the possible occurrence of limestones. To do this a geophysical campaign was planned through the electrical tomography technique, setting out quickly and noninvasively the distribution of different lithologies.
The aim of this geophysical campaign was to obtain resistivity values of existing materials in depth, in order to determine the contact of Quaternary colluvial materials and Calizas de Montaña Formation.
3. ELECTRICAL RESISTIVITY TOMOGRAPHY
Electrical Tomography is a geophysical technique for subsurface study that measures potential differences of the soil to learn the electrical properties of the ground. That is, this technique measures changes in the electrical resistivity of the subsurface materials, and provide an in-depth picture of the layers having different electrical behavior. For this reason it is considered the most suitable technique for determining contact between colluvial materials and limestone bedrock as high resistivity contrast between the colluvial soils and limestone are expected.
Electrical Tomography determine the distribution of soil resistivity until a certain range of depth along a profile, based on the apparent resistivity values obtained through measurements conducted by conventional methods of Direct Current (DC). This will get a model of real soil resistivity distribution in the subsurface, obtained by an inversion process from apparent resistivities estimated during data processing.
The apparent resistivity (rap) is the resistivity of all materials affected by the passage of an electric current (DC).
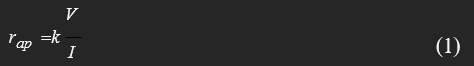
Where:
V, potential difference between two electrodes (called M and N).
I, intensity of the current introduced into the field between two electrodes (called A and B).
K, is a geometric constant dependent on the distances between the four electrodes A, B, M and N.
The representations of the apparent resistivity distribution in the subsurface are called pseudosections, while the real resistivity (r) is an intrinsic property of the rocks and depends on the lithology, factory and containing fluids.
Electrical tomography requires the use of specific instrumentation capable of performing a large number of measurements quickly and reliably. The equipment used for this campaign is a DC low frequency Terrameter, manufactured by the company ABEM, SAS-4000 model, with which a Wenner device for two wires has been employed. This device is considered ideal for the terrain studied Terrameter de CC de baja frecuencia, fabricado por la empresa ABEM, modelo SAS-4000, con el que se ha empleado un dispositivo Wenner de dos cables. Este dispositivo se considera ideal para el terreno estudiado.
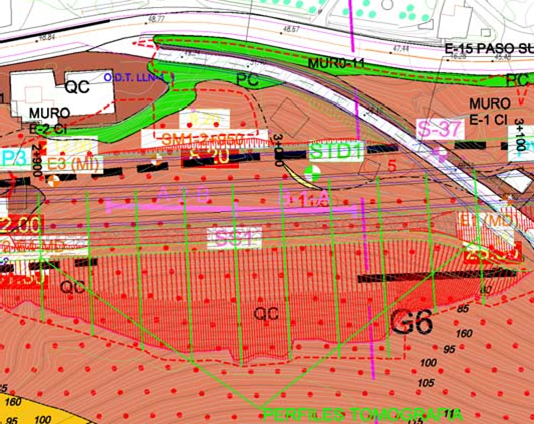
Figure 2. Position of electrical profiles (green lines) for geophysical campaign by electrical tomography.
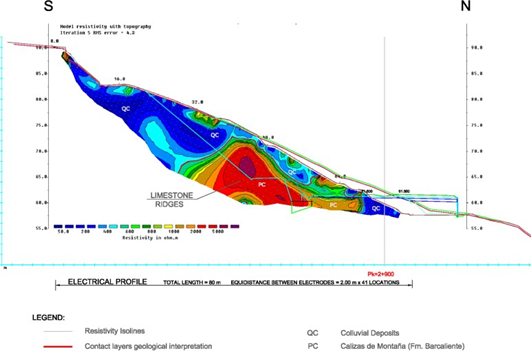
Figure 3. Profile 01 interpretation on the excavation of the slope.
To study this slope a mesh of 10 electrical profiles was designed, 9 transverse to the slope and the other one lengthwise (Fig. 2). The lengths of the cross sections are between 80 and 100 m, reaching 12.50 m depth the shortest and 15 m depth the longer. The longitudinal profile was performed using Roll-along technique63 electrodes were used reaching 180 m long and 20 m depth resolution.
4. RESULTS AND ACTIONS TAKEN
The interpretation of electrical tomography profiles shows the presence of limestone ridges in all the cross sections, although the level of coronation is highly variable due to the irregular geometry of the formation.
Hillside or colluvial deposits have a highly variable resistivity values since they are composed of a heterogeneous mixture of clay and limestone or quartzite cobbles.
When resistivity values are above 500 is interpreted as limestone bedrock. These limestones are karstified and very tectonised so, depending on their level of weathering resistivity values vary from 500 to 5000 ohm.m.
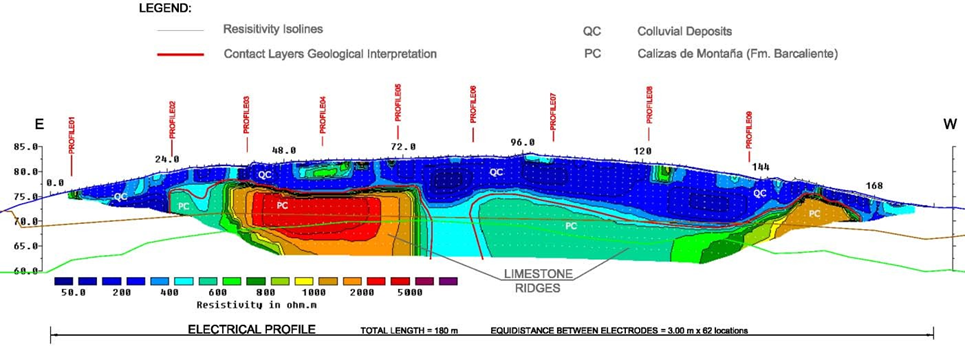
Figure 4. Longitudinal profile interpretation across the existing hillside, with the designed slope superimposed.
Figure 03 shows the interpretation of an electrical tomography profile on the current hillside and over- printed the future slope. The most superficial blue colors represent the conductive colluvial deposits while the greens and reds correspond to bedrock (resistivity values of limestones > 500 ohm.m). Also this profile shows that limestones are shaped like ridges.
In the longitudinal profile (Fig.04) the irregular morphology of limestone bedrock can be observed, and two limestone ridges are detected spaced 10 m.
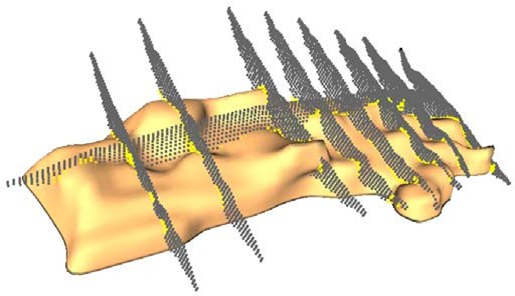
Based on the interpretation of electrical tomography, a 3D model showing the irregular topography of the contact between the colluvium and limestone becrock was also developed (Fig.5).
Figure 5. Design of soil nailing based on the occurrence of limestone detected by Electrical Tomography.
Through the interpreted geology from electrical tomography the slope stability has been modeled considering where limestones appeared. Limestones were detected from the base to the middle area of each profile. Thereby the need of a wall was discarded and replaced by a system of reinforcement with soil-nailing allowing some flexibility to continue or stop the reinforcement depending on whether bedrock appears. soil-nailing que permite cierta flexibilidad para continuar o detener el refuerzo en función de si aparece sustrato rocoso.
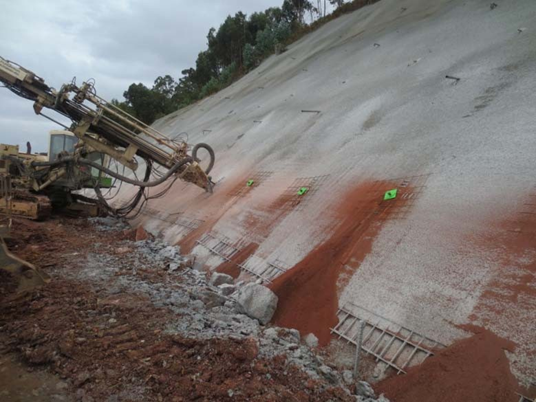
Figure 6. Design of soil nailing based on the occurrence of limestone detected by Electrical Tomography.
The new slope reinforcement design consists of (Fig. 6):
- Benches 1.60 m high.
- Mesh of soil-nailing Steel bars AE25 .
- Horizontal drains and weep holes.
The Soil Nailing technique soil nailing is used for reinforcement of terrains whose stability is not assured, as the case of colluvial Qc.
The fundamental concept of the soil nailing is to reinforce the ground by installing passive anchorage bars to which cement grout is injected at a slope or excavation, as a constructive process from the top to the lowest parts of the slope. This process avoids the decompression; since the slope decreases the bars are taking charge (Fig. 7).

Figure 7. Slope picture after placing soil-nailing in the top half.
5. CONCLUSIONS
The instability of a slope on colluvial materials requires investigating the geology of the area to know the position of the bedrock
Electrical tomography has proven to be a useful tool to know the precise position of the bedrock on a slope where other research techniques such as bore- holes could not be used by the steep slope and access problems.
The geophysical study has accurately adjusted the contact between the colluvial deposits and limestone bedrock, which reduced considerably the reinforcement measures needed to support the slope.
The presence of limestone at the base of the slope meant that there was no need to build a low gradient slope with a rockfill wall at the bottom, which was another option considered. Instead, the slope was reinforced through soil-nailing. This reinforcement also meant greater flexibility, compared to other more expensive solutions, and the slope becomes more vertical avoiding further land occupation. soil-nailing. Este refuerzo también supuso una mayor flexibilidad, en comparación con otras soluciones más costosas, y el talud se vuelve más vertical evitando una mayor ocupación de terreno.
6. ACKNOWLEDGMENTS
The authors wish to express their sincere gratitude to Elena del Soto and Carlos Quintanal, from FCC, for providing the drawings and images, as well as for their valuable comments regarding the progress of the works.

